Crosswalking data relationships for analysis
In our last post we discussed the crosswalk portion of the Results Data Initiative, a project with the goal to make results data more useful and relatable across development organizations. This process involves three main steps: data gathering, data organization, and data comparing and merging (i.e. “crosswalking”).
The first two steps allow us to produce a ‘microdata’ database using statistical information from several different donors and other development stakeholders. Although such a database represents a significant step forward in terms of data openness, discoverability, and usability, it doesn’t entirely engage with the question of results. Are donors producing comparable results with their projects? Are they interested in similar long-term objectives? Can we aggregate results in a given place or sector? To begin to answer these questions, we’ll need additional information about development projects and strategies.
The first step is to identify different data types, and how these types relate to each other. For our purposes we’ve identified three data types: objectives, conditions, and outputs. Objectives are large overall goals in a thematic field such as “reducing malaria” or “increasing agricultural productivity”; conditions represent the situation on the ground (i.e., infant mortality rates, crop yields); and outputs track the deliverables of development initiatives such as “1,000 household latrines built” or “10,000 vaccines administered.” The ideal is for these data types to form a causal chain of development: projects allocate resources that improve conditions that, over time, meet larger objectives.
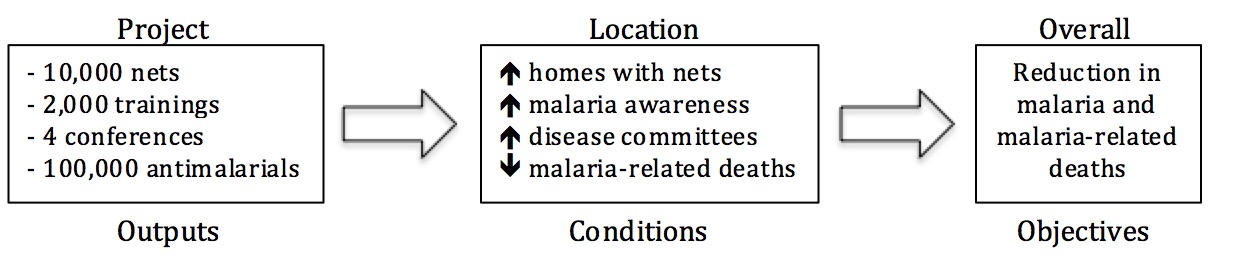
Figure 1: Example casual chain for reducing malaria.
Although identifying and validating causal pathways between donor outputs, conditions, and objectives is a key priority in development, this is a much larger debate that goes beyond the scope of our current crosswalk activity.
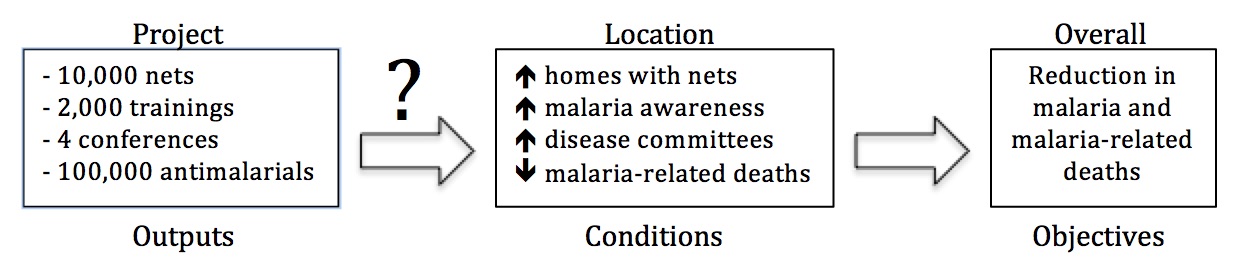
Figure 2: Whether and how outputs lead to condition changes is still unclear.
For our purposes, it is more important to first create clear linkages between data types across a wide range of projects and donors, so that we can have a clearer picture of overall output trends. To do this, we will use output information, as well as a few classification algorithms.
Of these data types, condition information is the most readily abundant and comprises the entirety of the microdata database we’ve already compiled. Many donors gather it as part of ongoing initiatives, but the bulk of condition data comes from large surveys such as WHO’s Global Health Observatory (GHO), USAID’s Demographic Health Survey (DHS), and national census information and are not directly linked to individual projects. Since these data represent entities within an administrative location, indicators from many different donors can be matched and merged as we’ve discussed in our last post.
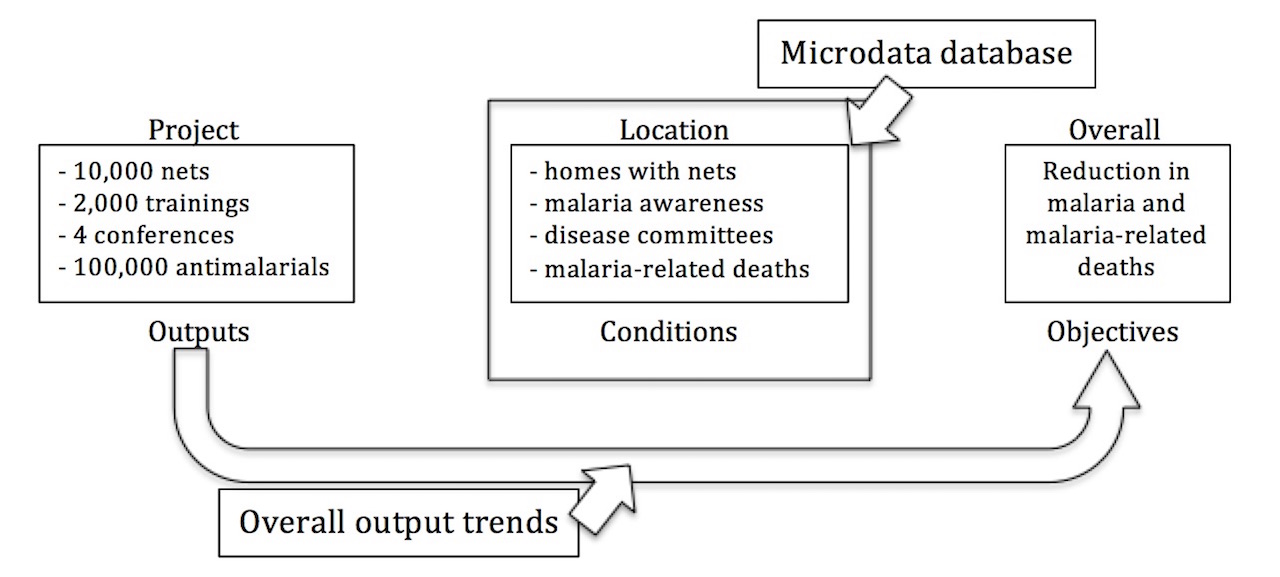
Figure 3: Data types and tracked relationships.
However, while condition data is becoming more ubiquitous and accessible, output information is still largely buried in project documentation, such as progress reports or project evaluations. This is less than ideal since it represents a scenario in which outputs and conditions are only ever linked together within the context of a specific project evaluation. Instead of this, we’d like to be able to track outputs and conditions at a larger scale and across organizations. Thus, although tedious, our first order of business is extracting output data from project documentation.
Once we have these output indicators, we run two classification algorithms. The first clusters outputs into different activity themes. For example, WHO may have conducted 1,000 HIV/AIDS awareness trainings as part of a project while USAID held workshops for 450 health professionals on effective HIV/AIDS treatment procedures. Both of these activities will be grouped as “training”-type outputs.
The second round of classification uses the language in project documentation itself to determine proposed objectives. In our limited sample of health and agricultural projects, we’ve compiled a list of objective keywords from the stated priorities of the donors in our sample. For example, as part of USAID’s global health initiatives it has the goal of “ending preventable child and maternal deaths”. By searching through project documentation for keywords such as “maternal deaths,” we can classify projects and programs based on their prioritized objectives.
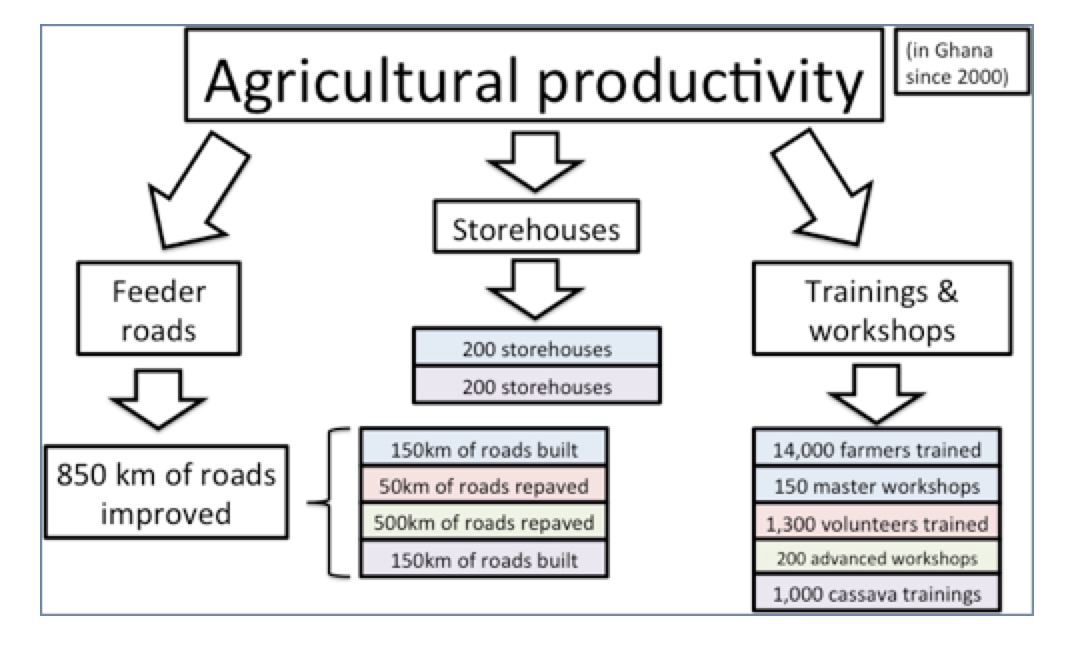
Figure 4: Classification of projects and objectives.
Once we combine these two classification activities, we have a powerful way of looking at total and type of activities meant to achieve certain objectives. And furthermore, by (eventually) adding geographic information, we can link these data types up with our microdata database as a means to more comprehensively observe what is happening in development and where and how these trends are influencing outcomes worldwide.
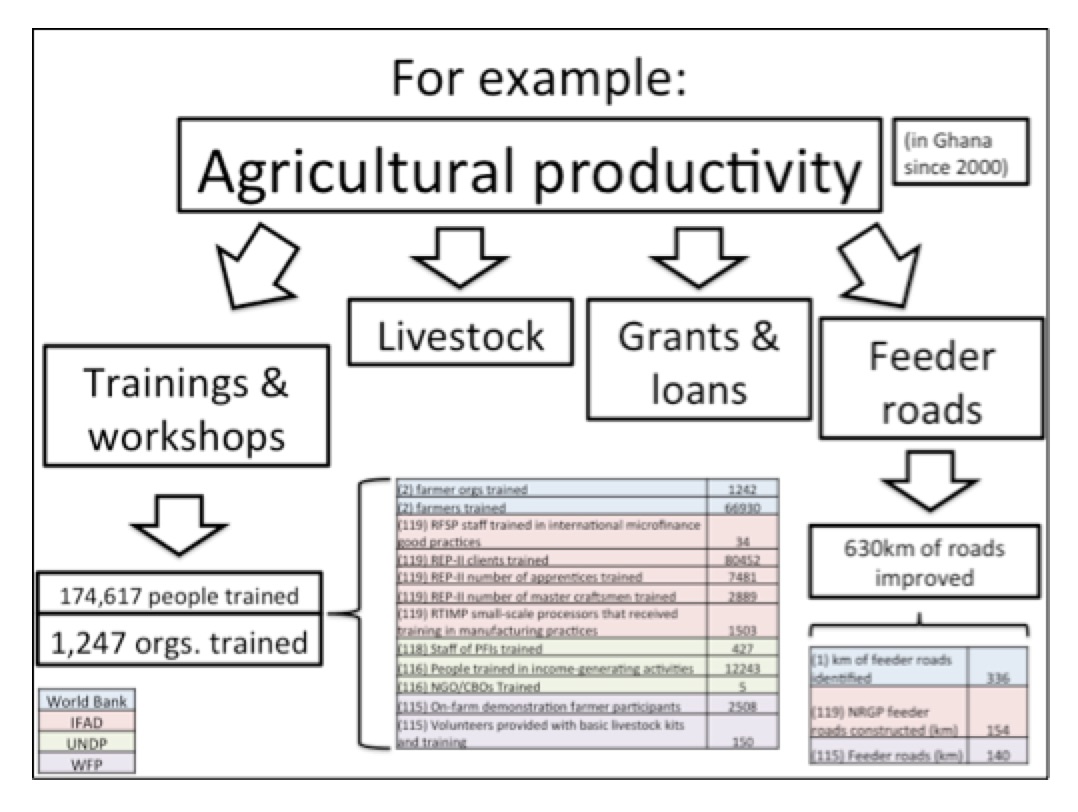
Figure 5: Example using real output data.
Share This Post
Related from our library
-1000x750.png)
The Results Data Initiative has Ended, but We’re still Learning from It
If an organization with an existing culture of learning and adaptation gets lucky, and an innovative funding opportunity appears, the result can be a perfect storm for changing everything. The Results Data Initiative was that perfect storm for DG. RDI confirmed that simply building technology and supplying data is not enough to ensure data is actually used. It also allowed us to test our assumptions and develop new solutions, methodologies & approaches to more effectively implement our work.
-1000x750.jpg)
Catalyzing Use of Gender Data
From our experience understanding data use, the primary obstacle to measuring and organizational learning from feminist outcomes is that development actors do not always capture gender data systematically. What can be done to change that?
Sharing DG’s Strategic Vision
Development Gateway’s mission is to support the use of data, technology, and evidence to create more effective and responsive institutions. We envision a world where institutions listen and respond to the needs of their constituents; are accountable; and are efficient in targeting and delivering services that improve lives. Since late 2018, we’ve been operating under